With the increasing amount of collected data comes demand for more answers. The field of data science is getting more and more popular, and the ability to review, cleanse and prepare existing hives of data into easy to understand and usable information is ever growing.
This month's meeting titled Data Storytelling using Power BI was all about how to deal with such kind of data in a sample scenario of a fictitious company. Starting with a set of raw information our presenters gave a brief overview of the concept of business intelligence (BI) and how use it for data storytelling, how to get the existing data into shape by cleansing it, how to enrich the information with looked up data and calculated columns, to finally demonstrate the visualisation capacities in Microsoft Power BI to produce visually appealing and usable dashboards.
What was it about?
The presentations were done the following MSCC craftsmen:
Let's see what happened during the meeting.
Introduction to Data Storytelling
First, Chervine gave us a brief introduction into the concept of data. How we should understand it, where it usually comes from, and what kind of questions could be answered by that information using the right techniques. This is where it comes down to the data storytelling.

It is up to your understanding of the data and on how to transform it into an actual story by answering those questions with visually appealing reports and charts.
Introduction to Power BI
One of the tools that could be used to convert your raw data information into an interesting story is Microsoft Power BI. Firdaws was next with an overview about what Power BI is, about to acquire it and what are the capabilities of this application. You would find all this kind of information on the their official product site, too.
Preparing & Modelling Data using Power BI
Then Dishay took over and demonstrated the data cleansing features of Power BI. Starting with a plain SQL query connected to an instance of SQL Server he imported those result sets into Power BI. Then came the process of data cleaning, removing duplicates and enhancing the overall quality of information.
Power BI operates on an abstraction layer to create a data dictionary of your sources. All manipulation steps are recorded and you can revert back to any previous stage without any issues. This approach can also be used for scripting.
Dishay then showed us how to remove obsolete columns, change the order of columns in a table, how insert new like plain columns, concatenated columns, foreign key columns, and added conditional expressions to filter and format the data. Power BI offers a feature-rich set of functionality.
The visualization capabilities of Power BI
Although Dishay gave us a peek of some simple reports it was Firdaws that really gave us an overdose of report capacities and features provided by Power BI. Beginning with a dashboard containing one report Firdaws continuously brought in new aspects of creating visually appealing and informative reports.
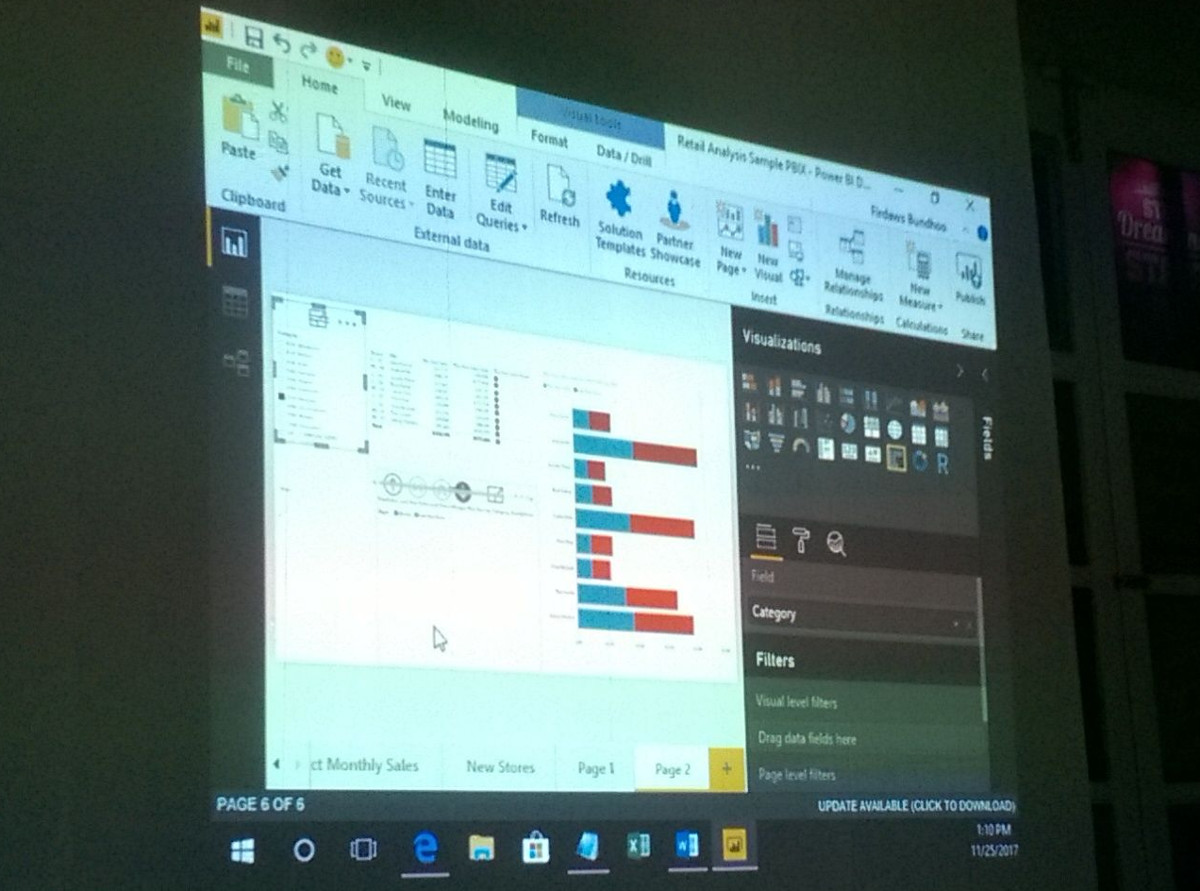
While adding more details and sophisticated features she also explained about the psychology and dynamics of proper positioning, formatting and labeling of information on a dashboard. At the end she had produced a powerful, interactive board with several reports including drill-downs and filtering capabilities. Full advanced mode on!
Publish & Share Power BI Dashboards
What is it good for having a great, informative dashboard with business-critical reports that you can't deliver to others, like ie. your superior? Right, absolutely nothing.

Firdaws then continued on showing us how to publish the just created dashboard and how to make it accessible for other users within your organisation. Very handy indeed and more versatile than exported PDF documents.
Walk-through of a Real-Time Power BI dashboard using Azure Services
At the end of our meeting Chervine showed us quickly on how to integrate other Azure services in order to inject a bit of artificial intelligence into your reports. There are options to integrate natural language processing and semantic analysis.
Final advice on data storytelling
Creating a proper and useful data story takes hours or even days to create. Surely, it is not something to attempt during a lunch break. Review your data, add missing information if needed and remove obsolete data to reduce the level of noise, simplicity is key. Like real stories make your own data storytelling an exciting experience not just some dull figures and graphs.
What other attendees are saying / writing
Read about the event on Varun's blog here: http://semi-colon.azurewebsites.net/2017/11/26/234/
Chervine left a great comment:
Was great to introduce Power BI last Saturday.
Great meetup and a very interactive audience!
Do not forget:
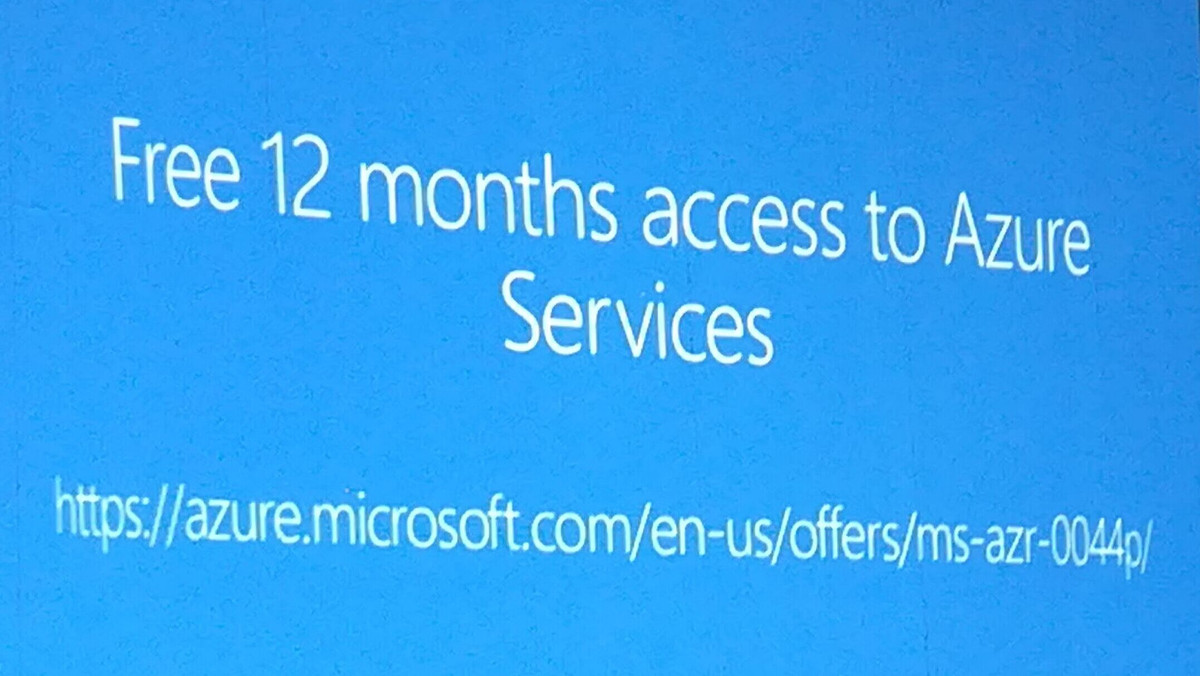
- Free 12 months access to Azure Services
- Get your free Power BI Account via an @mscc email address
Do not hesitate to post your questions (including bonus ones) and feedback here.
My take-away from the meeting
Great introduction into the capabilities, use cases and modern visualisations using Microsoft Power BI. It was enlightening to follow the process of data preparation and clean up in order to produce some stunning visuals.

Thanks to all presenters, it was a very informative session and I learned quite some new things. While having fun obviously...
Thanks!
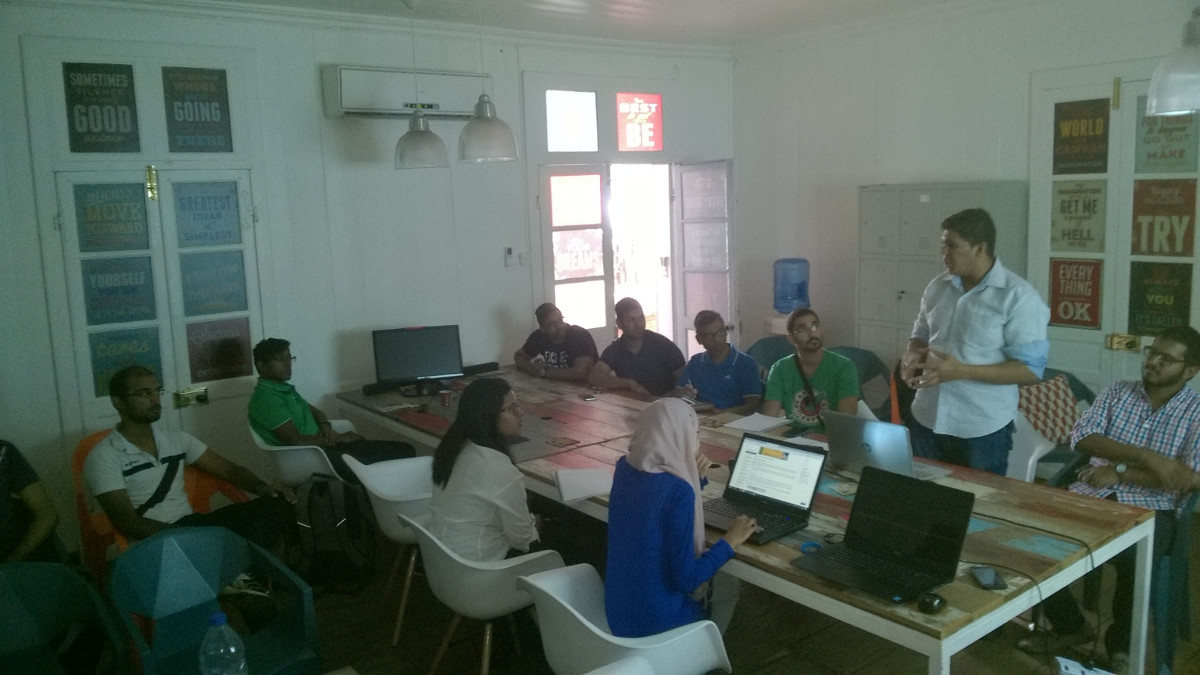
Shout out to CoWorking Port Louis who received us for the first time. CoWorking provides you with a relaxing environment and professional services right in the capital of Mauritius. Coolest office downtown Port Louis. Settle your office in a charming colonial house on an historic street in Port Louis. They provide an inspiring location to make your day pleasantly productive. The perfect place to work with like-minded creative people around.

Thanks to the support and sponsorship by JetBrains we were able to raffle out a coupon code for one of their amazing products.
Congrats to Tejuswi
There are more coupons for the upcoming months and we're looking forward to corporate closer with JetBrains for future events.